Singular Value Decomposition#
Teng-Jui Lin
Content adapted from UW AMATH 301, Beginning Scientific Computing, in Spring 2020.
Singular value decomposition
Dimensionality reduction of data
Image compression
scipyimplementationSingular value decomposition by
scipy.linalg.svd()
Singular value decomposition and approximations#
Singular value decomposition (SVD) decomposes a matrix
SVD can also be written as
so we can approximate the matrix
It minimizes the sum of squares of perpendicular distance from the data points (if the columns of
Dimensionality reduction of data#
Problem Statement. Singular value decomposition of linear data.
(a) Generate a linear data of the form
(b) Decompose the linear data using singular value decomposition by scipy.linalg.svd() and take its rank-1 approximation.
(c) Plot the data and its rank-1 approximation as a line and as points.
import numpy as np
import scipy
from scipy import linalg
import random
import matplotlib.pyplot as plt
# generate data
random.seed(1)
linear_data_x = np.arange(0, 5.25, 0.25)
linear_data_y = np.array([i + random.random() for i in linear_data_x])
X = np.array([linear_data_x, linear_data_y])
# singular value decomposition
U, s, Vh = scipy.linalg.svd(X, full_matrices=False)
S = np.diag(s)
# rank-1 approx
X_rank1 = S[0, 0] * np.outer(U[:, 0], Vh[0, :])
X_rank1
array([[0.06659661, 0.6524675 , 0.84344595, 0.82375337, 1.17533243,
        1.38500408, 1.7176178 , 2.01802888, 1.90606842, 2.1060413 ,
        2.73867512, 2.77137569, 3.16713975, 3.02280876, 3.47496112,
        3.84427762, 3.83247952, 4.42005492, 4.63076781, 4.43158733,
        4.66148114],
       [0.0760325 , 0.7449138 , 0.96295146, 0.94046869, 1.341862  ,
        1.58124144, 1.96098227, 2.30395776, 2.17613394, 2.40444042,
        3.12671036, 3.16404418, 3.61588294, 3.4511021 , 3.96731867,
        4.38896258, 4.37549285, 5.04632016, 5.28688838, 5.05948657,
        5.3219534 ]])
# plot settings
%config InlineBackend.figure_format = 'retina'
%matplotlib inline

plt.rcParams.update({
    'font.family': 'Arial',  # Times New Roman, Calibri
    'font.weight': 'normal',
    'mathtext.fontset': 'cm',
    'font.size': 18,

    'lines.linewidth': 2,

    'axes.linewidth': 2,
    'axes.spines.top': False,
    'axes.spines.right': False,
    'axes.titleweight': 'bold',
    'axes.titlesize': 18,
    'axes.labelweight': 'bold',

    'xtick.major.size': 8,
    'xtick.major.width': 2,
    'ytick.major.size': 8,
    'ytick.major.width': 2,

    'figure.dpi': 80,

    'legend.framealpha': 1,
    'legend.edgecolor': 'black',
    'legend.fancybox': False,
    'legend.fontsize': 14
})
fig, ax = plt.subplots(figsize=(4, 4))
ax.plot(linear_data_x, linear_data_y, 'o', label='Data points')
ax.plot(X_rank1[0, :], X_rank1[1, :])
ax.plot(X_rank1[0, :], X_rank1[1, :], '.', color='black', label='Rank-1 approx')
ax.set_xlabel('$x$')
ax.set_ylabel('$y$')
ax.set_title('$y(x)$')
ax.set_xlim(0)
ax.set_ylim(0)
ax.legend()
<matplotlib.legend.Legend at 0x1553d9a2608>
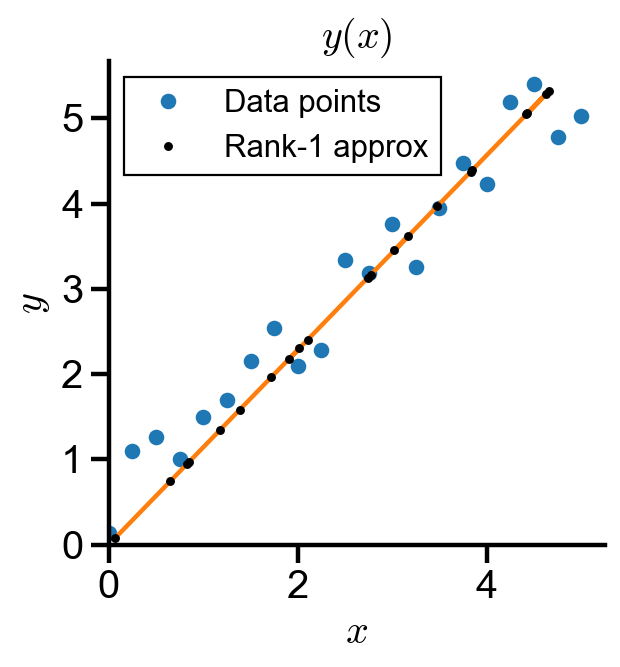
Image compression#
SVD can reducing the dimension of the image by only storing the top rank approximations. Compared to storing the full image matrix, storing the factorized matrices uses up much smaller space.
Problem Statement. Singular value decomposition for image compression.
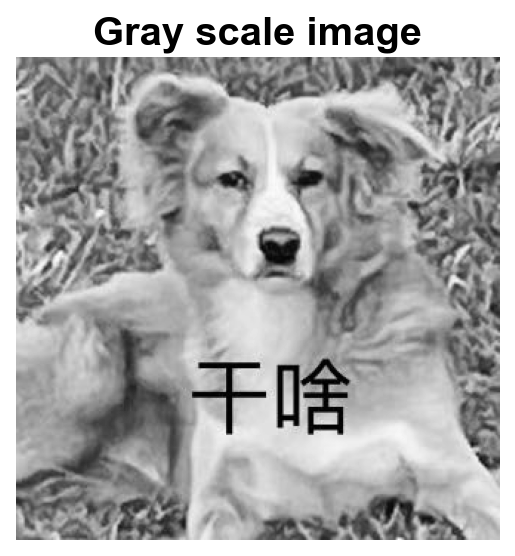
(a) Import the image dog.jpg and perform singular value decomposition.
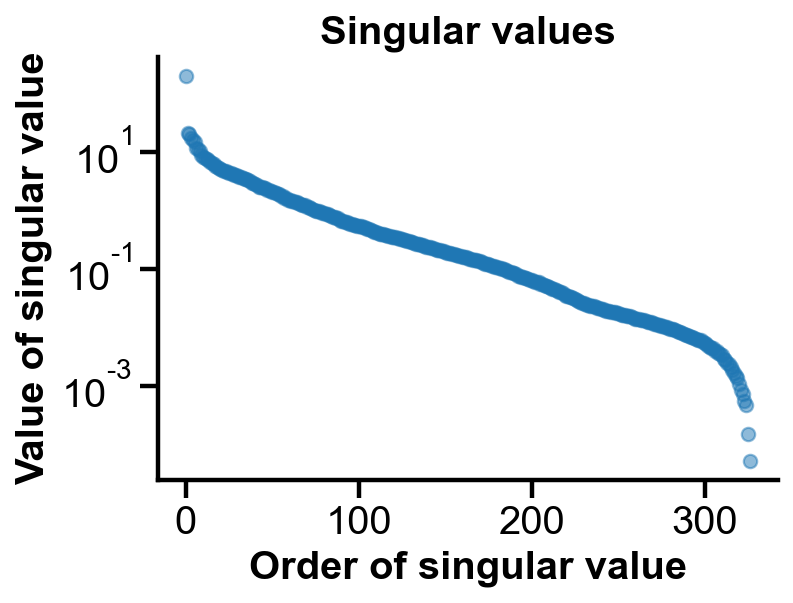
(b) Examine the magnitude of singular values in a semilogy plot.
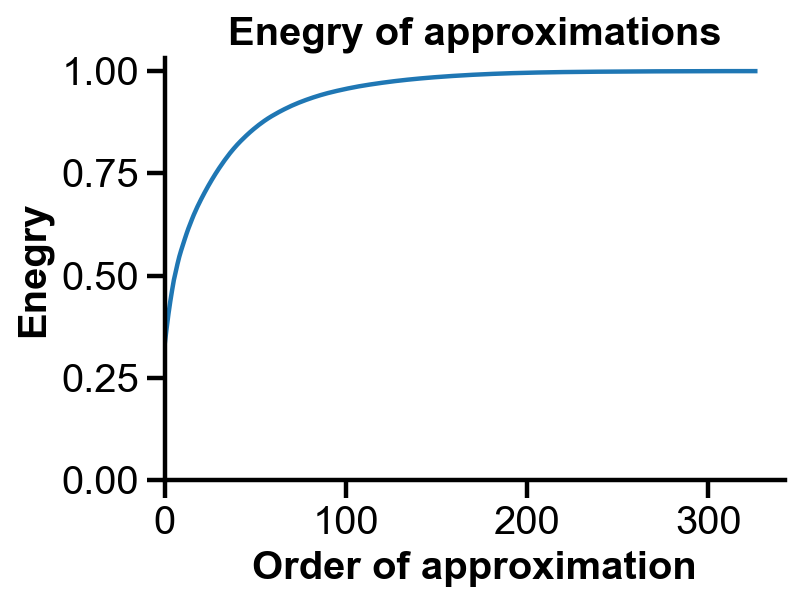
(c) Examine the energy captured by rank-r approximations, where r is an integer.
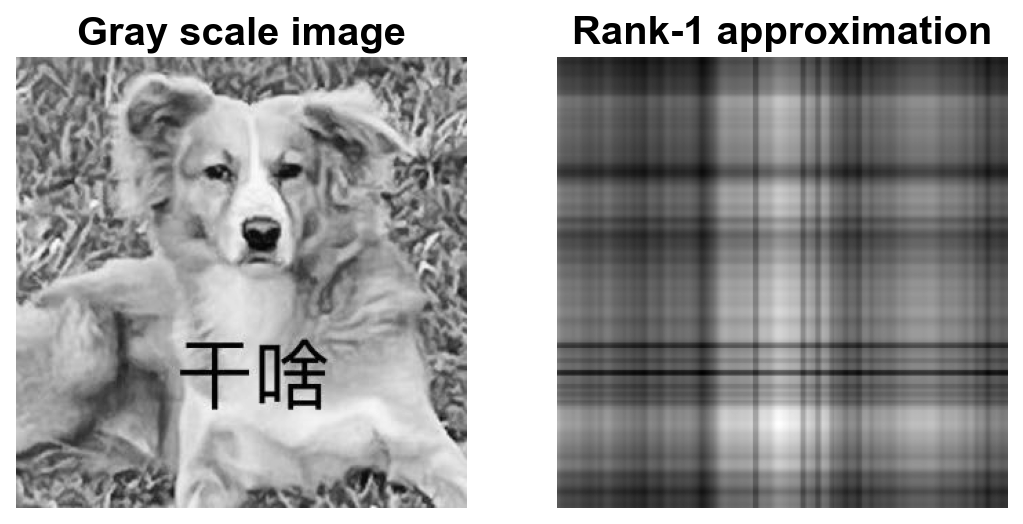
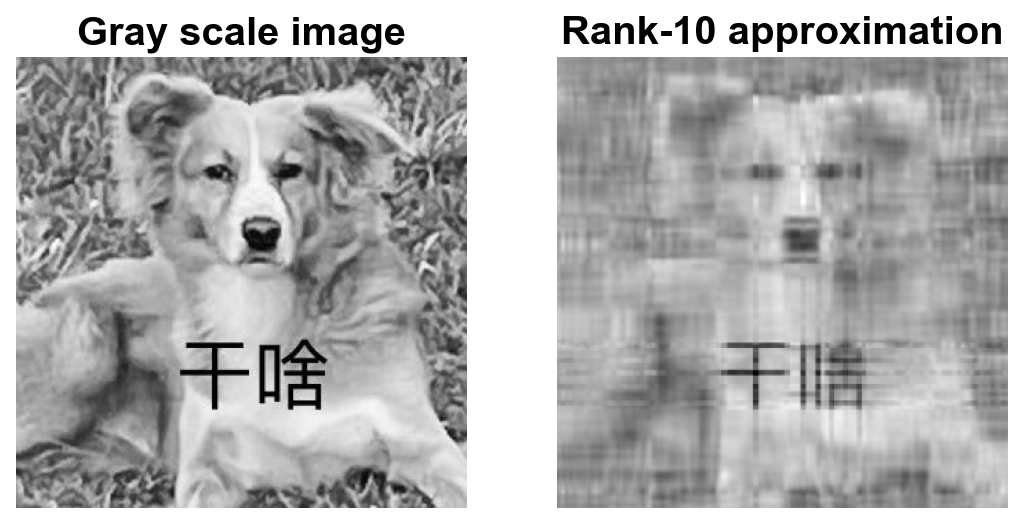
(d) Visualize rank-1, 10, and 50 approximations of the image and calculate the energy captured and the compression rate of each approximation.
Import and view images#
import skimage
from skimage import io
img = io.imread('dog.jpg')
img.shape
(327, 327, 3)
gray_img = skimage.color.rgb2gray(img)
gray_img.shape
(327, 327)
fig, ax = plt.subplots(figsize=(4, 4))
ax.imshow(gray_img, cmap='gray')
ax.set_title('Gray scale image')
ax.axis('off')
(-0.5, 326.5, 326.5, -0.5)
# singular value decomposition
U, s, Vh = scipy.linalg.svd(gray_img, full_matrices=False)
S = np.diag(s)
Value of singular values#
A few singular values are greater than others and stores the most information.
fig, ax = plt.subplots(figsize=(5, 3.5))
ax.semilogy(np.arange(len(s)), s, 'o', alpha=0.5)
ax.set_xlabel('Order of singular value')
ax.set_ylabel('Value of singular value')
ax.set_title('Singular values')
# ax.set_xlim(0)
Text(0.5, 1.0, 'Singular values')
Energy of approximations#
Rank-1 approximation alone can store 40% of the information. To stores 80% information, about rank-50 approximation could be used.
energies = np.cumsum(s) / np.sum(s)
fig, ax = plt.subplots(figsize=(5, 3.5))
ax.plot(np.arange(len(s)), energies)
ax.set_xlabel('Order of approximation')
ax.set_ylabel('Enegry')
ax.set_title('Enegry of approximations')
ax.set_xlim(0)
ax.set_ylim(0)
(0.0, 1.0332684596481563)
Visualizations of approximations#
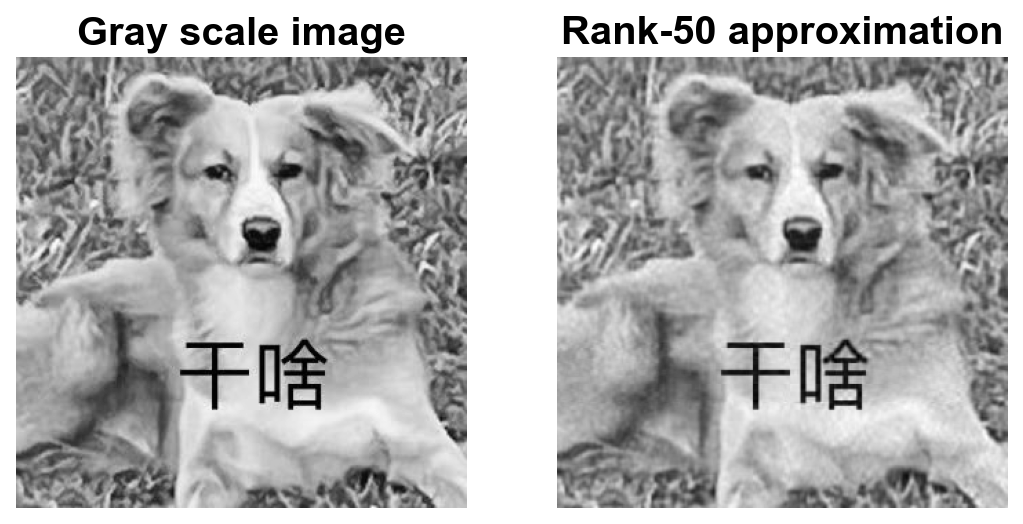
We visualize lower rank approximations and calculate the energy and compression rate of each approximation.
# rank 1 approx
img_rank1 = U[:, 0:1] @ S[0:1, 0:1] @ Vh[0:1, :]
# energy of rank 1 approx
energy_rank1 = np.sum(s[:1]) / np.sum(s)
round(energy_rank1, 2)
0.33
# compression rate
compression_rate =  (U.shape[0]*1 + 1 + Vh.shape[0]*1 ) / gray_img.size
round(compression_rate, 4)
0.0061
fig, axs = plt.subplots(1, 2, figsize=(8, 4))
axs[0].imshow(gray_img, cmap='gray')
axs[0].set_title('Gray scale image')
axs[0].axis('off')

axs[1].imshow(img_rank1, cmap='gray')
axs[1].set_title('Rank-1 approximation')
axs[1].axis('off')
(-0.5, 326.5, 326.5, -0.5)
# rank 10 approx
r = 10
img_rank10 = U[:, 0:r] @ S[0:r, 0:r] @ Vh[0:r, :]
# energy of rank 10 approx
energy_rank10 = np.sum(s[:r]) / np.sum(s)
round(energy_rank10, 2)
0.56
# compression rate
compression_rate =  (U.shape[0]*r + r + Vh.shape[0]*r ) / gray_img.size
round(compression_rate, 4)
0.0613
fig, axs = plt.subplots(1, 2, figsize=(8, 4))
axs[0].imshow(gray_img, cmap='gray')
axs[0].set_title('Gray scale image')
axs[0].axis('off')

axs[1].imshow(img_rank10, cmap='gray')
axs[1].set_title(f'Rank-{r} approximation')
axs[1].axis('off')
(-0.5, 326.5, 326.5, -0.5)
# rank r approx
r = 50
img_rank_r = U[:, 0:r] @ S[0:r, 0:r] @ Vh[0:r, :]
# energy of rank r approx
energy_rank_r = np.sum(s[:r]) / np.sum(s)
round(energy_rank_r, 2)
0.86
# compression rate
compression_rate =  (U.shape[0]*r + r + Vh.shape[0]*r ) / gray_img.size
round(compression_rate, 4)
0.3063
fig, axs = plt.subplots(1, 2, figsize=(8, 4))
axs[0].imshow(gray_img, cmap='gray')
axs[0].set_title('Gray scale image')
axs[0].axis('off')

axs[1].imshow(img_rank_r, cmap='gray')
axs[1].set_title(f'Rank-{r} approximation')
axs[1].axis('off')
(-0.5, 326.5, 326.5, -0.5)
