Curve Fitting and Interpolation#
Teng-Jui Lin
Content adapted from UW AMATH 301, Beginning Scientific Computing, in Spring 2020.
Curve fitting
Curve fitting using error functions and
scipy.optimize.fmin()Sum of squared error
Sum of absolute error
Maximum absolute error
Choice of error functions
General curve fitting by
scipy.optimize.curve_fit()Curve fitting of polynomials by
numpy.polyfit()andnumpy.polyval()
Interpolation
Interpolation by
scipy.interpolate.interp1d()
Curve fitting and error functions#
Goal: find the parameters
Given data points
The sum of squared error (SSE) is defined as
The sum of absolute error (SAE) is defined as
The maximum absolute error (MAE) is defined as
Average error is most resistant to outliers. Maximum error is sensitive to outliers. Sum of squared error penalizes large errors.
Minimization of error function by scipy.optimize.fmin() can give desired parameter.
Implementation#
Problem Statement. The Gaussian function has the form
(a) Generate a Gaussian data of such form in the domain
(b) Fit the data with the Gaussian function using SSE, SAE, and MAE defined above.
(c) Fit the data using scipy.optimize.curve_fit()
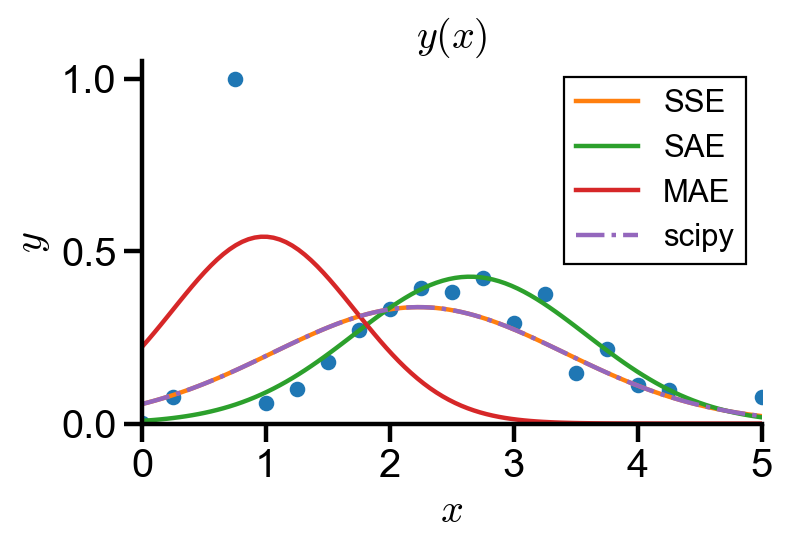
(d) Plot the resulting fit and discuss the resistance to outliers of each error.
Generate data#
import numpy as np
import scipy
from scipy import optimize
import matplotlib.pyplot as plt
# generate data
np.random.seed(1)
gaussian = lambda x, sigma, mu : 1/np.sqrt(2*np.pi*sigma**2) * np.exp(-(x - mu)**2 / (2*sigma**2))
gaussian_data_x = np.arange(0, 5.25, 0.25)
gaussian_data_y = np.array([gaussian(i, 1, 2.5) + 0.2*(np.random.random() - 0.5) for i in gaussian_data_x])
gaussian_data_y[3] = 1  # create outlier
Curve fitting using error functions and scipy.optimize.fmin()#
# define fitting function
gaussian = lambda x, sigma, mu : 1/np.sqrt(2*np.pi*sigma**2) * np.exp(-(x - mu)**2 / (2*sigma**2))
def sse(k):
    '''
    Finds sum of squared error of data point and fitting function with given params.
    Note that the coordinates of data points and the fitting function is interited from global.
    This design is needed for scipy.optimize.fmin input.

    :params k: parameters of fitting function
    :returns: sum of squared error
    '''

    X = gaussian_data_x
    Y = gaussian_data_y
    f = gaussian
    error = sum((Y - f(X, *k))**2)
    return error
def sae(k):
    '''
    Finds sum of absolute error of data point and fitting function with given params.
    Note that the coordinates of data points and the fitting function is interited from global.
    This design is needed for scipy.optimize.fmin input.

    :params k: parameters of fitting function
    :returns: sum of absolute error
    '''

    X = gaussian_data_x
    Y = gaussian_data_y
    f = gaussian
    error = sum(abs(Y - f(X, *k)))
    return error
def mae(k):
    '''
    Finds maximum of absolute error of data point and fitting function with given params.
    Note that the coordinates of data points and the fitting function is interited from global.
    This design is needed for scipy.optimize.fmin input.

    :params k: parameters of fitting function
    :returns: maximum of absolute error
    '''

    X = gaussian_data_x
    Y = gaussian_data_y
    f = gaussian
    error = max(abs(Y - f(X, *k)))
    return error
initial_guess = [1, 2]
sse_fit_params = scipy.optimize.fmin(sse, initial_guess)
sse_fit_x = np.linspace(0, 5, 100)
sse_fit_y = gaussian(sse_fit_x, *sse_fit_params)
sse_fit_params
Optimization terminated successfully.
         Current function value: 0.854724
         Iterations: 30
         Function evaluations: 57
array([1.18010444, 2.23083503])
initial_guess = [1, 2]
sae_fit_params = scipy.optimize.fmin(sae, initial_guess)
sae_fit_x = np.linspace(0, 5, 100)
sae_fit_y = gaussian(sae_fit_x, *sae_fit_params)
sae_fit_params
Optimization terminated successfully.
         Current function value: 1.739172
         Iterations: 38
         Function evaluations: 75
array([0.93549152, 2.6457473 ])
initial_guess = [1, 2]
mae_fit_params = scipy.optimize.fmin(mae, initial_guess)
mae_fit_x = np.linspace(0, 5, 100)
mae_fit_y = gaussian(mae_fit_x, *mae_fit_params)
mae_fit_params
Optimization terminated successfully.
         Current function value: 0.483690
         Iterations: 46
         Function evaluations: 86
array([0.73508355, 0.98207847])
Curve fitting using scipy.optimize.curve_fit()#
scipy.optimize.curve_fit() takes in functional form and data points and returns the coefficients of best fit.
# use scipy.optimize.curve_fit()
scipy_fit_params, pcov = scipy.optimize.curve_fit(gaussian, gaussian_data_x, gaussian_data_y)
scipy_fit_x = np.linspace(0, 5, 100)
scipy_fit_y = gaussian(scipy_fit_x, *scipy_fit_params)
scipy_fit_params
array([1.18008327, 2.23083067])
Plotting#
# plot settings
%config InlineBackend.figure_format = 'retina'
%matplotlib inline

plt.rcParams.update({
    'font.family': 'Arial',  # Times New Roman, Calibri
    'font.weight': 'normal',
    'mathtext.fontset': 'cm',
    'font.size': 18,

    'lines.linewidth': 2,

    'axes.linewidth': 2,
    'axes.spines.top': False,
    'axes.spines.right': False,
    'axes.titleweight': 'bold',
    'axes.titlesize': 18,
    'axes.labelweight': 'bold',

    'xtick.major.size': 8,
    'xtick.major.width': 2,
    'ytick.major.size': 8,
    'ytick.major.width': 2,

    'figure.dpi': 80,

    'legend.framealpha': 1,
    'legend.edgecolor': 'black',
    'legend.fancybox': False,
    'legend.fontsize': 14
})
fig, ax = plt.subplots(figsize=(5, 3))
ax.plot(gaussian_data_x, gaussian_data_y, 'o')
ax.plot(sse_fit_x, sse_fit_y, label='SSE')
ax.plot(sae_fit_x, sae_fit_y, label='SAE')
ax.plot(mae_fit_x, mae_fit_y, label='MAE')
ax.plot(scipy_fit_x, scipy_fit_y, '-.', label='scipy')
ax.set_xlabel('$x$')
ax.set_ylabel('$y$')
ax.set_title('$y(x)$')
ax.set_xlim(0, 5)
ax.set_ylim(0)
ax.legend()
<matplotlib.legend.Legend at 0x17d8702cdc8>

As shown in the graph, maximum of absolute error is very sensitive to outliers, and sum of absolute error is resistant to outliers. scipy.optimize.curve_fit() uses the sum of squared error.
Curve fitting of polynomial functions using numpy#
numpy.polyfit() takes in data points and polynomial order and returns the coefficients of best fit polynomial.
numpy.polyval() takes in polynomial coefficients and x point(s) to be evaluated.
Implementation#
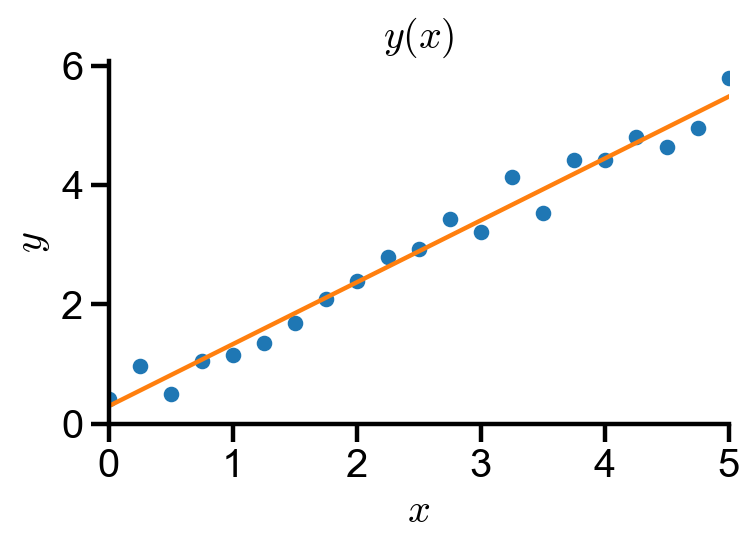
Problem Statement. Fitting linear data.
(a) Generate a linear data of the form
(b) Fit the data with the linear fit numpy.polyfit().
(c) Plot the resulting fit using numpy.polyval().
# generate data
np.random.seed(1)
linear_data_x = np.arange(0, 5.25, 0.25)
linear_data_y = np.array([i + np.random.random() for i in linear_data_x])
# polynomial fit (linear in this case)
linear_fit_x = np.linspace(0, 5, 100)
linear_fit_coeff = np.polyfit(linear_data_x, linear_data_y, 1)
linear_fit_y = np.polyval(linear_fit_coeff, linear_fit_x)
fig, ax = plt.subplots(figsize=(5, 3))
ax.plot(linear_data_x, linear_data_y, 'o')
ax.plot(linear_fit_x, linear_fit_y)
ax.set_xlabel('$x$')
ax.set_ylabel('$y$')
ax.set_title('$y(x)$')
ax.set_xlim(0, 5)
ax.set_ylim(0)
(0.0, 6.076120631559354)

Interpolation using scipy#
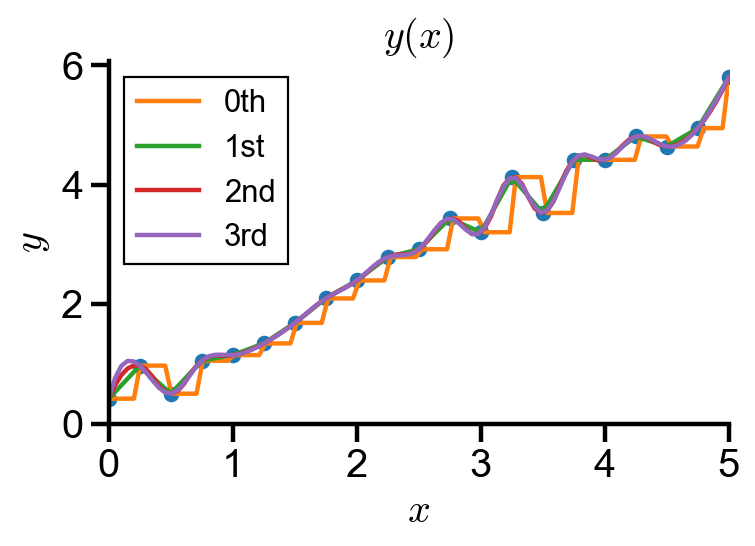
scipy.interpolate.interp1d() provides interpolation of zeroth, first, second, and third order (constant, linear, quadratic, cubic) of scalar functions.
Implementation#
Problem Statement. Interpolating linear data.
(a) Generate a linear data of the form
(b) Interpolate the data using scipy.interpolate.interp1d() for zeroth order, linear, quadratic, and cubic spline.
(c) Plot the resulting interpolation.
import scipy
from scipy import interpolate
# generate data
np.random.seed(1)
linear_data_x = np.arange(0, 5.25, 0.25)
linear_data_y = np.array([i + np.random.random() for i in linear_data_x])
# linear spline
spline_x = np.linspace(0, 5, 100)
f_zero = scipy.interpolate.interp1d(linear_data_x, linear_data_y, kind='zero')
f_linear = scipy.interpolate.interp1d(linear_data_x, linear_data_y, kind='linear')
f_quadratic = scipy.interpolate.interp1d(linear_data_x, linear_data_y, kind='quadratic')
f_cubic = scipy.interpolate.interp1d(linear_data_x, linear_data_y, kind='cubic')
fig, ax = plt.subplots(figsize=(5, 3))
ax.plot(linear_data_x, linear_data_y, 'o')
ax.plot(spline_x, f_zero(spline_x), label='0th')
ax.plot(spline_x, f_linear(spline_x), label='1st')
ax.plot(spline_x, f_quadratic(spline_x), label='2nd')
ax.plot(spline_x, f_cubic(spline_x), label='3rd')
ax.set_xlabel('$x$')
ax.set_ylabel('$y$')
ax.set_title('$y(x)$')
ax.set_xlim(0, 5)
ax.set_ylim(0)
ax.legend()
<matplotlib.legend.Legend at 0x17d87052508>


