Chaotic Systems 2#
Teng-Jui Lin
Content from UW AMATH 301, Beginning Scientific Computing. Although not covered in Spring 2020, the topic is presented in previous years: (1) Application of Runge-Kutta to Lorenz Equation, (2) Vectorized Time-step Integrators.
Chaotic system
Lorenz system (continued)
A cube of initial conditions
Visialization techniques
Interactive plotting
Animations
Lorenz system (review)#
The Lorenz system is a system of nonlinear ODEs developed by Edward Lorenz in 1963 to model atmospheric convection. The system
with parameters
Note on animation: for local reproducible results, download ffmpeg and add to path variable. For reproducible results online, use Google Colab and run the command below.
# Run the command in Google Colab for reproducible results online
# !apt install ffmpeg
import numpy as np
import matplotlib.pyplot as plt
from mpl_toolkits.mplot3d import Axes3D
import scipy
from scipy import integrate
# plot settings
%config InlineBackend.figure_format = 'retina'
%matplotlib inline
plt.rcParams.update({
'font.family': 'Arial', # Times New Roman, Calibri
'font.weight': 'normal',
'mathtext.fontset': 'cm',
'font.size': 18,
'lines.linewidth': 2,
'axes.linewidth': 2,
'axes.spines.top': False,
'axes.spines.right': False,
'axes.titleweight': 'bold',
'axes.titlesize': 18,
'axes.labelweight': 'bold',
'xtick.major.size': 8,
'xtick.major.width': 2,
'ytick.major.size': 8,
'ytick.major.width': 2,
'figure.dpi': 80,
'savefig.dpi': 300,
'legend.framealpha': 1,
'legend.edgecolor': 'black',
'legend.fancybox': False,
'legend.fontsize': 14,
'animation.html': 'html5',
})
A cube of initial conditions#
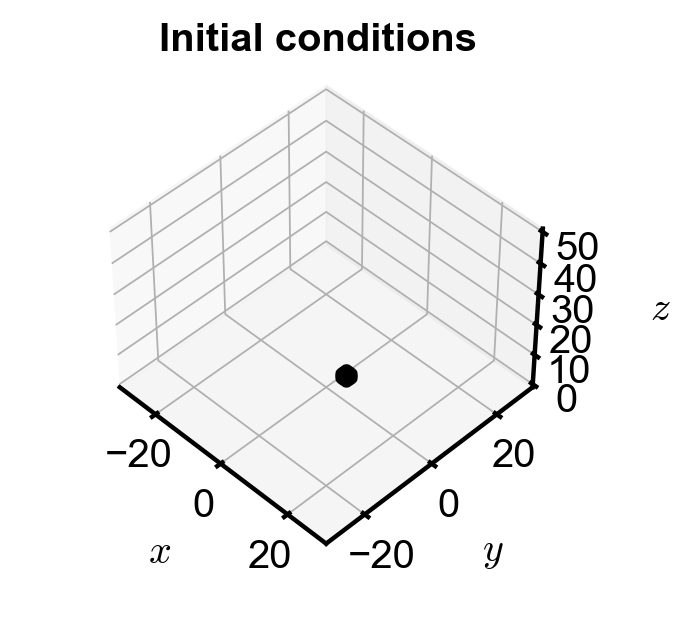
Problem Statement. Solve the Lorenz system with cubes of initial conditions of
a cube of points with dimension of 40 with intervals
for
a cube of points with dimension of 20 with intervals
for
a cube of points with dimension of 2 with intervals
for
a cube of points with dimension of 2 with intervals
for
a cube of points with dimension of 2 with intervals
for
using the above parameters. Generate an interactive plot of the trajectory over time. Save the the interactive plot as an animation.
Solution. Here, we demonstrate the last set of initial conditions.
Solving the systems and static plot#
# Lorenz's chaotic parameters
sigma = 10
beta = 8/3
rho = 28
# initial conditions defining params
dimension = 2
interval = 0.1
center = np.array([3, 3, 3])
# calculate cube of initial conditions
half_dim = dimension / 2
xvec = np.arange(-half_dim, half_dim+interval/2, interval)
yvec = np.arange(-half_dim, half_dim+interval/2, interval)
zvec = np.arange(-half_dim, half_dim+interval/2, interval)
x_len = len(xvec)
y_len = len(yvec)
z_len = len(zvec)
initial_val_vec = np.array(np.meshgrid(xvec+center[0], yvec+center[1], zvec+center[2]))
# time array
t_initial = 0
t_final = 15
dt = 1/70
t = np.arange(t_initial, t_final+dt/2, dt)
t_len = len(t)
t_len
1051
# define ode system
dxdt = lambda x, y, z : sigma*(y - x)
dydt = lambda x, y, z : x*(rho - z) - y
dzdt = lambda x, y, z : x*y - beta*z
def ode_syst(t, v):
'''System of ODEs for Lorenz system.'''
# convert 1d input from solve_ivp() back to proper dimension
v = v.reshape(3, x_len, y_len, z_len)
return np.array([dxdt(*v), dydt(*v), dzdt(*v)])
# solve ode system
# note: solve_ivp() only accepts 1d array as initial condition,
# so ode_syst need to covert the initial condition vector back
ode_soln_raw = scipy.integrate.solve_ivp(ode_syst,
[t_initial, t_final],
initial_val_vec.reshape(-1),
t_eval=t, vectorized=True).y
# reshape the soln dimension to proper form
ode_soln = ode_soln_raw.reshape(3, x_len*y_len*z_len, len(t))
# plot 3d visualization
plt.rcParams.update({'xtick.labelsize': 18,})
fig, ax = plt.subplots(figsize=(5, 5), subplot_kw={"projection": "3d"})
ax.plot(*ode_soln[:, :, 0], '.', color='black', alpha=0.1)
# plot setting
ax.set_xlabel('$x$', fontsize=18, labelpad=20)
ax.set_ylabel('$y$', fontsize=18, labelpad=20)
ax.set_zlabel('$z$', fontsize=18, labelpad=20)
ax.set_title(f'Initial conditions', fontsize=18, y=1)
ax.set_xlim(-30, 30)
ax.set_ylim(-30, 30)
ax.set_zlim(0, 50)
ax.view_init(45, -45) # viewing angle
ax.dist = 13 # zoom out to fit all labels in

Interactive plot and animation of trajectory over time#
# animation parameters
# note that here we assume one frame per data dt
fps = 60
anim_time = t_len / fps # s
frame_num = t_len
# interactive plot
%matplotlib qt
# plot static portion
fig, ax = plt.subplots(figsize=(7, 7), subplot_kw={"projection": "3d"})
ax.set_xlim(-30, 30)
ax.set_ylim(-25, 25)
ax.set_zlim(0, 50)
ax.set_axis_off()
# plot empty framework
points, = ax.plot([], [], [], '.', color='black', alpha=0.1)
title = ax.set_title('')
# update changes each frame
for n in range(frame_num):
time_points = round(t_len/frame_num)
points.set_data(ode_soln[:2, :, time_points*n:time_points*n+time_points].reshape(2, -1))
points.set_3d_properties(ode_soln[2, :, time_points*n:time_points*n+time_points].flatten())
title.set_text(f't = {t[n] :.3f}')
plt.pause(0.00001)
# back to static plot and animations
%matplotlib inline
# plot static portion
fig, ax = plt.subplots(figsize=(7, 7), subplot_kw={"projection": "3d"})
ax.set_xlim(-30, 30)
ax.set_ylim(-25, 25)
ax.set_zlim(0, 50)
ax.set_axis_off()
# plot empty framework
points, = ax.plot([], [], [], '.', color='black', alpha=0.1)
title = ax.set_title('')
def draw_frame(n):
'''
Commands to update parameters.
Here, the 3d data points and title changes each frame.
'''
time_points = round(t_len/frame_num)
points.set_data(ode_soln[:2, :, time_points*n:time_points*n+time_points].reshape(2, -1))
points.set_3d_properties(ode_soln[2, :, time_points*n:time_points*n+time_points].flatten())
title.set_text(f't = {t[n] :.3f}')
return fig,
# create animation of the data
# note that here we assume one frame per data dt
# the expected animation time is t_len/60
from matplotlib import animation
anim = animation.FuncAnimation(fig, draw_frame, frames=frame_num, interval=1000/fps, blit=True)
plt.close()
# convert animation to video (time-limiting step)
from IPython.display import HTML
HTML(anim.to_html5_video() + '<style>video{width: 400px !important; height: auto;}</style>')

