Numerical Differentiation#
Teng-Jui Lin
Content adapted from UW AMATH 301, Beginning Scientific Computing, in Spring 2020.
Numerical differentiation
First order methods
Forward difference
Backward difference
Second order methods
Central difference
Other second order methods
Errors
numpyimplementationData differentiation by
numpy.gradient()
Numerical differentiation of known function#
From the definition of derivative, the forward difference approximation is given by
The backward difference approximation is given by
The central difference approximation is given by
which is the average of forward and backward difference.
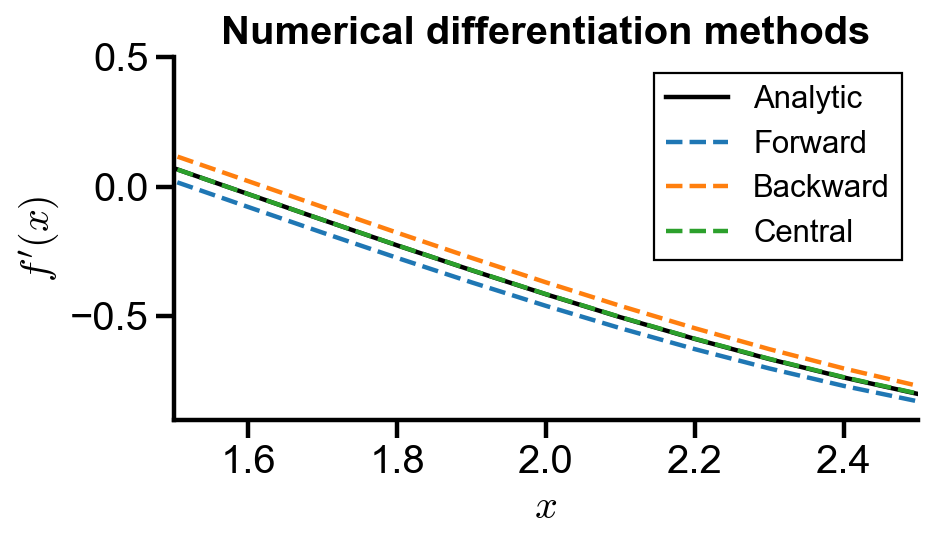
Forward and backward difference are
Implementation#
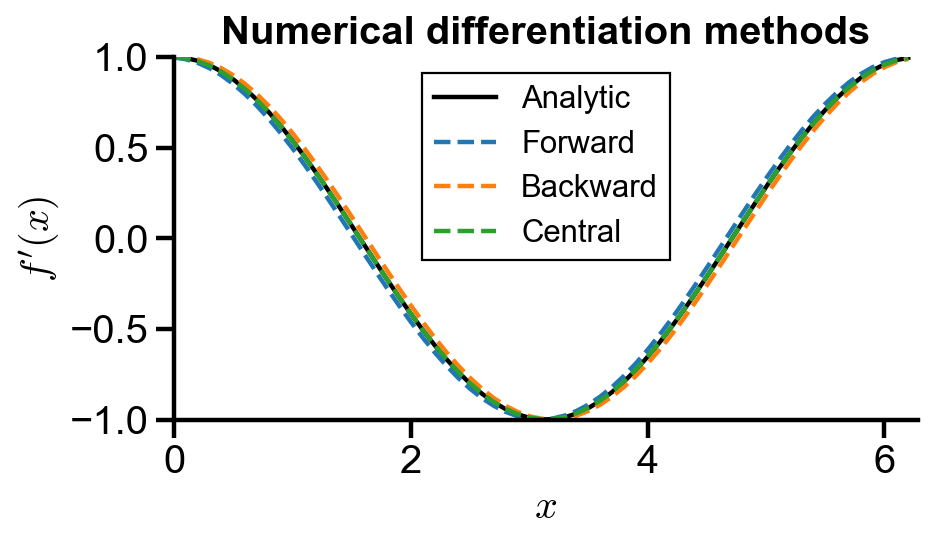
Problem Statement. Find the derivative of the function
using analytic expression, forward difference, backward difference, and central difference. compare their accuracy using a plot.
import numpy as np
import matplotlib.pyplot as plt
# target function
f = lambda x : np.sin(x)
df = lambda x : np.cos(x)  # analytic for comparison
x = np.arange(0, 2*np.pi, 0.1)
def forward_diff(f, x, dx):
    return (f(x + dx) - f(x))/dx
def backward_diff(f, x, dx):
    return (f(x) - f(x - dx))/dx
def central_diff(f, x, dx):
    return (f(x + dx) - f(x - dx))/(2*dx)
dx = 0.1
forward_df = forward_diff(f, x, dx)
backward_df = backward_diff(f, x, dx)
central_df = central_diff(f, x, dx)
# plot settings
%config InlineBackend.figure_format = 'retina'
%matplotlib inline

plt.rcParams.update({
    'font.family': 'Arial',  # Times New Roman, Calibri
    'font.weight': 'normal',
    'mathtext.fontset': 'cm',
    'font.size': 18,

    'lines.linewidth': 2,

    'axes.linewidth': 2,
    'axes.spines.top': False,
    'axes.spines.right': False,
    'axes.titleweight': 'bold',
    'axes.titlesize': 18,
    'axes.labelweight': 'bold',

    'xtick.major.size': 8,
    'xtick.major.width': 2,
    'ytick.major.size': 8,
    'ytick.major.width': 2,

    'figure.dpi': 80,

    'legend.framealpha': 1,
    'legend.edgecolor': 'black',
    'legend.fancybox': False,
    'legend.fontsize': 14
})
fig, ax = plt.subplots(figsize=(6, 3))
ax.plot(x, df(x), label='Analytic', color='black')
ax.plot(x, forward_df, '--', label='Forward')
ax.plot(x, backward_df, '--', label='Backward')
ax.plot(x, central_df, '--', label='Central')
ax.set_xlabel('$x$')
ax.set_ylabel('$f\'(x)$')
ax.set_title('Numerical differentiation methods')
ax.set_xlim(0, 2*np.pi)
ax.set_ylim(-1, 1)
ax.legend()
<matplotlib.legend.Legend at 0x1bf00d07f08>
fig, ax = plt.subplots(figsize=(6, 3))
ax.plot(x, df(x), label='Analytic', color='black')
ax.plot(x, forward_df, '--', label='Forward')
ax.plot(x, backward_df, '--', label='Backward')
ax.plot(x, central_df, '--', label='Central')
ax.set_xlabel('$x$')
ax.set_ylabel('$f\'(x)$')
ax.set_title('Numerical differentiation methods')
ax.set_xlim(1.5, 2.5)
ax.set_ylim(-0.9, 0.5)
ax.legend()
<matplotlib.legend.Legend at 0x1bf13f8db08>
Error and method order#
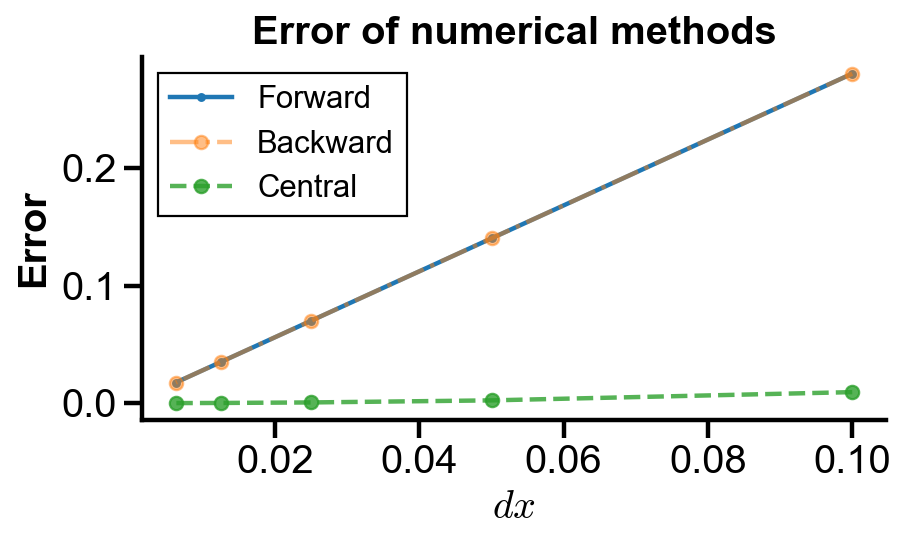
Problem Statement. Compare the error of forward difference, backward difference, and central difference with analytic derivative of the function
Compare the error of the methods using a plot.
# target function
f = lambda x : np.sin(x)
df = lambda x : np.cos(x)  # analytic for comparison
x = np.arange(0, 2*np.pi, 0.1)
dx = np.array([0.1 / 2**i for i in range(5)])
forward_errors = np.zeros(len(dx))
backward_errors = np.zeros(len(dx))
central_errors = np.zeros(len(dx))
for i in range(len(dx)):
    forward_df = forward_diff(f, x, dx[i])
    backward_df = backward_diff(f, x, dx[i])
    central_df = central_diff(f, x, dx[i])
    forward_errors[i] = np.linalg.norm(df(x) - forward_df)
    backward_errors[i] = np.linalg.norm(df(x) - backward_df)
    central_errors[i] = np.linalg.norm(df(x) - central_df)
fig, ax = plt.subplots(figsize=(6, 3))
ax.plot(dx, forward_errors, '.-', label='Forward')
ax.plot(dx, backward_errors, 'o-.', label='Backward', alpha=0.5)
ax.plot(dx, central_errors, 'o--', label='Central', alpha=0.8)
ax.set_xlabel('$dx$')
ax.set_ylabel('Error')
ax.set_title('Error of numerical methods')
# ax.set_xlim(1.5, 2.5)
# ax.set_ylim(-0.9, 0.5)
ax.legend()
<matplotlib.legend.Legend at 0x1bf14450bc8>
Numerical differentiation of data#
Implementation#
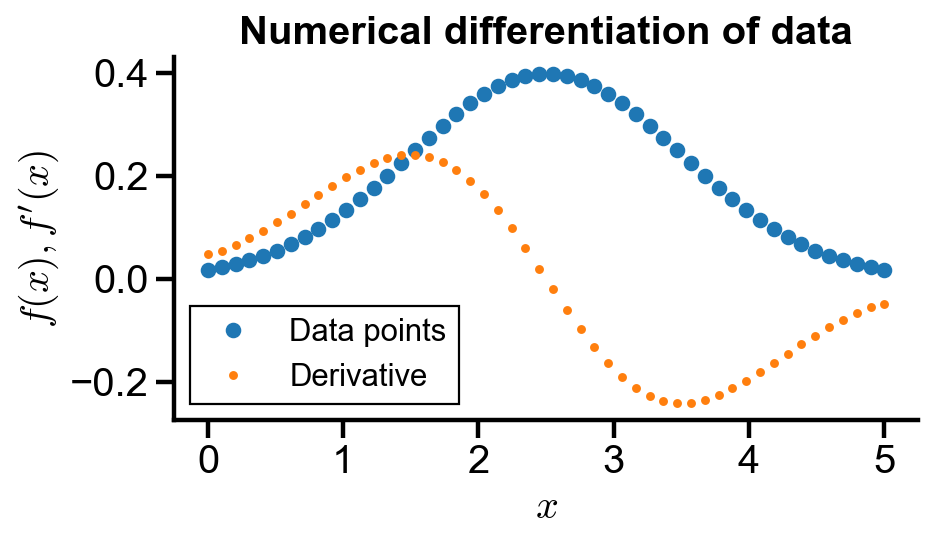
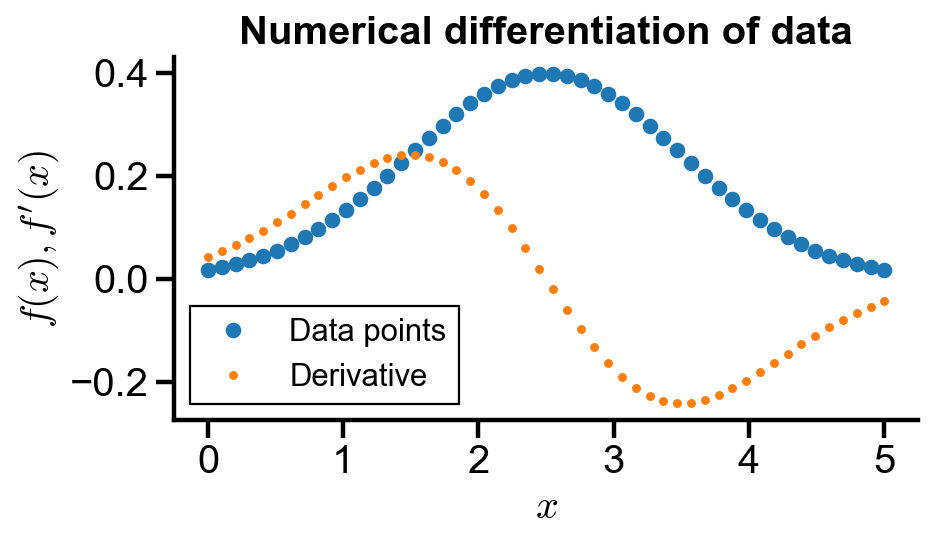
Problem Statement. The Gaussian function has the form
(a) Generate an equidistant Gaussian dataset of such form in the domain
(b) Find the numerical derivative of the data points using second order methods and numpy.gradient(). Plot the data and the derivative.
# generate data
gaussian = lambda x, sigma, mu : 1/np.sqrt(2*np.pi*sigma**2) * np.exp(-(x - mu)**2 / (2*sigma**2))
gaussian_data_x = np.linspace(0, 5, 50)
gaussian_data_y = np.array([gaussian(i, 1, 2.5) for i in gaussian_data_x])
def numerical_diff(data_x, data_y):
    '''
    Numerically differentiate given equidistant data points.
    Central difference is used in middle.
    Second order forward and backward difference used at end points.

    :param data_x: x-coordinates of data points
    :param data_y: y-coordinates of data points
    :returns: numerical derivative of data points
    '''

    df = np.zeros_like(data_x)
    dx = data_x[1] - data_x[0]  # assume equidistant points
    df[0] = (-3*data_y[0] + 4*data_y[1] - data_y[2])/(2*dx)
    df[-1] = (3*data_y[-1] - 4*data_y[-2] + data_y[-3])/(2*dx)
    df[1:-1] = (data_y[2:] - data_y[0:-2])/(2*dx)

    return df
fig, ax = plt.subplots(figsize=(6, 3))
ax.plot(gaussian_data_x, gaussian_data_y, 'o', label='Data points')
ax.plot(gaussian_data_x, numerical_diff(gaussian_data_x, gaussian_data_y), '.', label='Derivative')
ax.set_xlabel('$x$')
ax.set_ylabel('$f(x), f\'(x)$')
ax.set_title('Numerical differentiation of data')
# ax.set_xlim(1.5, 2.5)
# ax.set_ylim(-0.9, 0.5)
ax.legend()
<matplotlib.legend.Legend at 0x1bf148a97c8>
Numerical differentiation of data with numpy#
numpy.gradient() has similar implementation as above. It uses central difference in the middle, and forward and backward differences at the end points.
dx = gaussian_data_x[1] - gaussian_data_x[0]
gaussian_df = np.gradient(gaussian_data_y, dx)
fig, ax = plt.subplots(figsize=(6, 3))
ax.plot(gaussian_data_x, gaussian_data_y, 'o', label='Data points')
ax.plot(gaussian_data_x, gaussian_df, '.', label='Derivative')
ax.set_xlabel('$x$')
ax.set_ylabel('$f(x), f\'(x)$')
ax.set_title('Numerical differentiation of data')
# ax.set_xlim(1.5, 2.5)
# ax.set_ylim(-0.9, 0.5)
ax.legend()
<matplotlib.legend.Legend at 0x1bf149144c8>
