Spring-Mass-Damper System#
Teng-Jui Lin
Content adapted from UW AMATH 301, Beginning Scientific Computing, in Spring 2020.
Phase portraits
Spring-mass-damper system
Spring-mass-damper system#
Consider a horizontal spring-mass-damper system. We have the following laws
Without external forces, we have the following ODE:
Isolate the second derivative, we have
that can be written as a system of first-order ODEs
Problem Statement. With the initial conditions of
Model |
|||
|---|---|---|---|
Base case |
3 |
3 |
1 |
1-1 |
3 |
3 |
0 |
1-2 |
3 |
3 |
0.1 |
1-3 |
3 |
3 |
1 |
2-1 |
3 |
1 |
0.1 |
2-2 |
3 |
3 |
0.1 |
2-3 |
3 |
9 |
0.1 |
3-1 |
1 |
3 |
0.1 |
3-2 |
3 |
3 |
0.1 |
3-3 |
9 |
3 |
0.1 |
in
Base case#
import numpy as np
import matplotlib.pyplot as plt
import scipy
from scipy import integrate
# physical params
m = 3
k = 3
c = 1
# initial conditions
x0 = 3
v0 = 1
initial_val = [x0, v0]
# time array
t_initial = 0
t_final = 200
dt = 0.1
t = np.arange(t_initial, t_final+dt/2, dt)
# governing ode system
dxdt = lambda x, v : v
dvdt = lambda x, v : -k/m*x - c/m*v
ode_func = lambda t, z : np.array([dxdt(*z), dvdt(*z)])
ode_soln = scipy.integrate.solve_ivp(ode_func, [t_initial, t_final], initial_val, t_eval=t)
# plot settings
%config InlineBackend.figure_format = 'retina'
%matplotlib inline

plt.rcParams.update({
    'font.family': 'Arial',  # Times New Roman, Calibri
    'font.weight': 'normal',
    'mathtext.fontset': 'cm',
    'font.size': 18,

    'lines.linewidth': 2,

    'axes.linewidth': 2,
    'axes.spines.top': False,
    'axes.spines.right': False,
    'axes.titleweight': 'bold',
    'axes.titlesize': 18,
    'axes.labelweight': 'bold',

    'xtick.major.size': 8,
    'xtick.major.width': 2,
    'ytick.major.size': 8,
    'ytick.major.width': 2,

    'figure.dpi': 80,

    'legend.framealpha': 1,
    'legend.edgecolor': 'black',
    'legend.fancybox': False,
    'legend.fontsize': 14
})
# quiver grid
xvec = np.linspace(-5, 5, 20)
vvec = np.linspace(-5, 5, 20)
X, V = np.meshgrid(xvec, vvec)
fig, ax = plt.subplots(figsize=(5, 5))
# plot phase portrait
scale = np.sqrt(dxdt(X, V)**2 + dvdt(X, V)**2)
ax.quiver(X, V, dxdt(X, V)/scale, dvdt(X, V)/scale, scale, cmap='winter_r', scale=25, width=0.005)
ax.plot(*initial_val, 'o', color='black', label='Initial')
ax.plot(ode_soln.y[0], ode_soln.y[1], color='black')
ax.plot(ode_soln.y[0, -1], ode_soln.y[1, -1], 'X', color='red', zorder=4, label='Final')

# plot setting
ax.plot([-5, 5], [0, 0], color='black')
ax.plot([0, 0], [-5, 5], color='black')
ax.set_xlim(-5, 5)
ax.set_ylim(-5, 5)
ax.set_xlabel('$x$')
ax.set_ylabel('$v$')
ax.set_title(f'Phase Portrait (m = {m}, c = {c})')
ax.legend(loc='upper right')
<matplotlib.legend.Legend at 0x1c0ff96ca48>
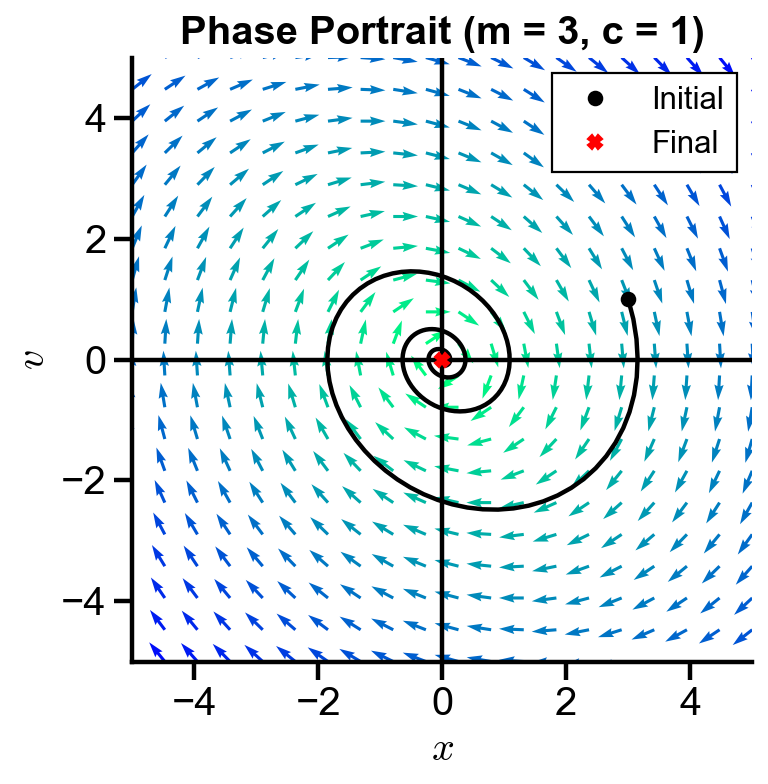
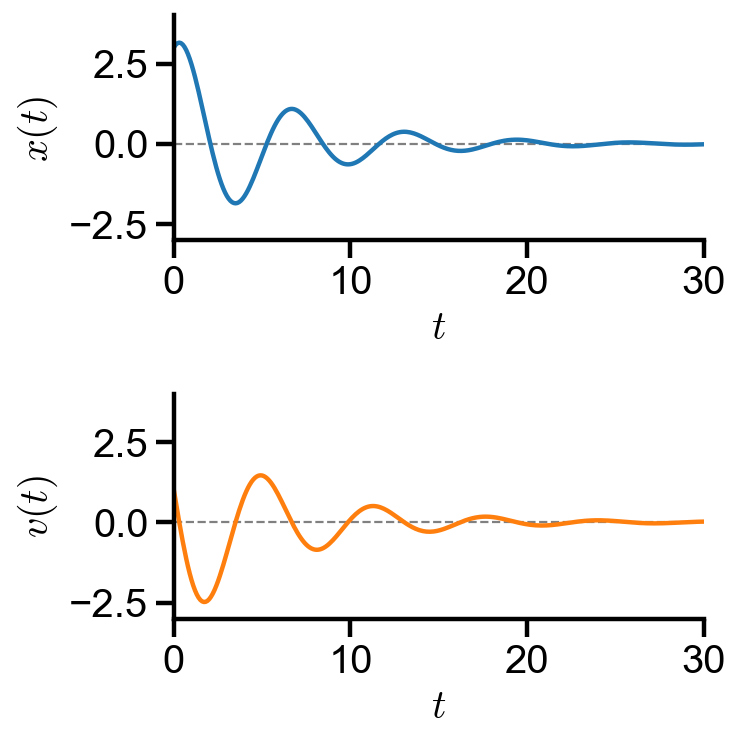
▲ The slope fields spirals into the origin, so the system will be at equilibrium position with zero velocity over time for
fig, axs = plt.subplots(2, 1, figsize=(5, 5))
axs[0].plot(t, ode_soln.y[0], color='tab:blue', label='$x(t)$')
axs[1].plot(t, ode_soln.y[1], color='tab:orange', label='$v(t)$')
axs[0].set_ylabel('$x(t)$')
axs[1].set_ylabel('$v(t)$')

for i in range(2):
    axs[i].plot([0, 30], [0, 0], '--', color='grey', lw=1, zorder=0)
    # # plot settings
    axs[i].set_xlim(0, 30)
    axs[i].set_ylim(-3, 4)
    axs[i].set_xlabel('$t$')
plt.tight_layout()
Changing damping constant
# physical params
m = 3
k = 3
c = np.array([0, 0.1, 1])
# initial conditions
x0 = 3
v0 = 1
initial_val = [x0, v0]
# time array
t_initial = 0
t_final = 50
dt = 0.1
t = np.arange(t_initial, t_final, dt)
# quiver grid
xvec = np.linspace(-5, 5, 20)
vvec = np.linspace(-5, 5, 20)
X, V = np.meshgrid(xvec, vvec)
fig1, axs1 = plt.subplots(1, 3, figsize=(12, 4))
plt.tight_layout()
fig2, axs2 = plt.subplots(2, 3, figsize=(12, 4), sharex=True, sharey=True)
plt.tight_layout()

for i in range(len(c)):
    # governing ode system
    dxdt = lambda x, v : v
    dvdt = lambda x, v : -k/m*x - c[i]/m*v
    ode_func = lambda t, z : np.array([dxdt(*z), dvdt(*z)])
    # ode soln
    ode_soln = scipy.integrate.solve_ivp(ode_func, [t_initial, t_final], initial_val, t_eval=t)
    # plot phase portrait
    scale = np.sqrt(dxdt(X, V)**2 + dvdt(X, V)**2)
    axs1[i].quiver(X, V, dxdt(X, V)/scale, dvdt(X, V)/scale, scale, cmap='winter_r', scale=20, width=0.005)
    axs1[i].plot(*initial_val, 'o', color='black', label='Initial')
    axs1[i].plot(ode_soln.y[0], ode_soln.y[1], color='black')
    axs1[i].plot(ode_soln.y[0, -1], ode_soln.y[1, -1], 'X', color='red', zorder=4, label='Final')
    # plot settings
    axs1[i].plot([-5, 5], [0, 0], color='black')
    axs1[i].plot([0, 0], [-5, 5], color='black')
    axs1[i].set_xlim(-5, 5)
    axs1[i].set_ylim(-5, 5)
    axs1[i].set_xlabel('$x$')
    axs1[i].set_ylabel('$v$')
    axs1[i].set_title(f'Phase Portrait (c = {c[i]})')
    axs1[i].set_aspect(1.0/axs1[i].get_data_ratio())  # square aspect
    # plot pver time
    axs2[0, i].plot(t, ode_soln.y[0], label='$x(t)$')
    axs2[1, i].plot(t, ode_soln.y[1], color='tab:orange', label='$v(t)$')
    axs2[1, 1].set_xlabel('$t$')
    axs2[0, 0].set_ylabel('$x(t)$')
    axs2[1, 0].set_ylabel('$v(t)$')
    axs2[0, i].set_title(f'c = {c[i]}')
    # plot settings
    for j in range(2):
        axs2[j, i].plot([0, 50], [0, 0], '--', color='grey', lw=0.5, zorder=0)
        # # plot settings
        axs2[j, i].set_xlim(0, 50)
        axs2[j, i].set_ylim(-5, 5)

axs1[-1].legend(loc='upper right')
<matplotlib.legend.Legend at 0x1c08c30cbc8>
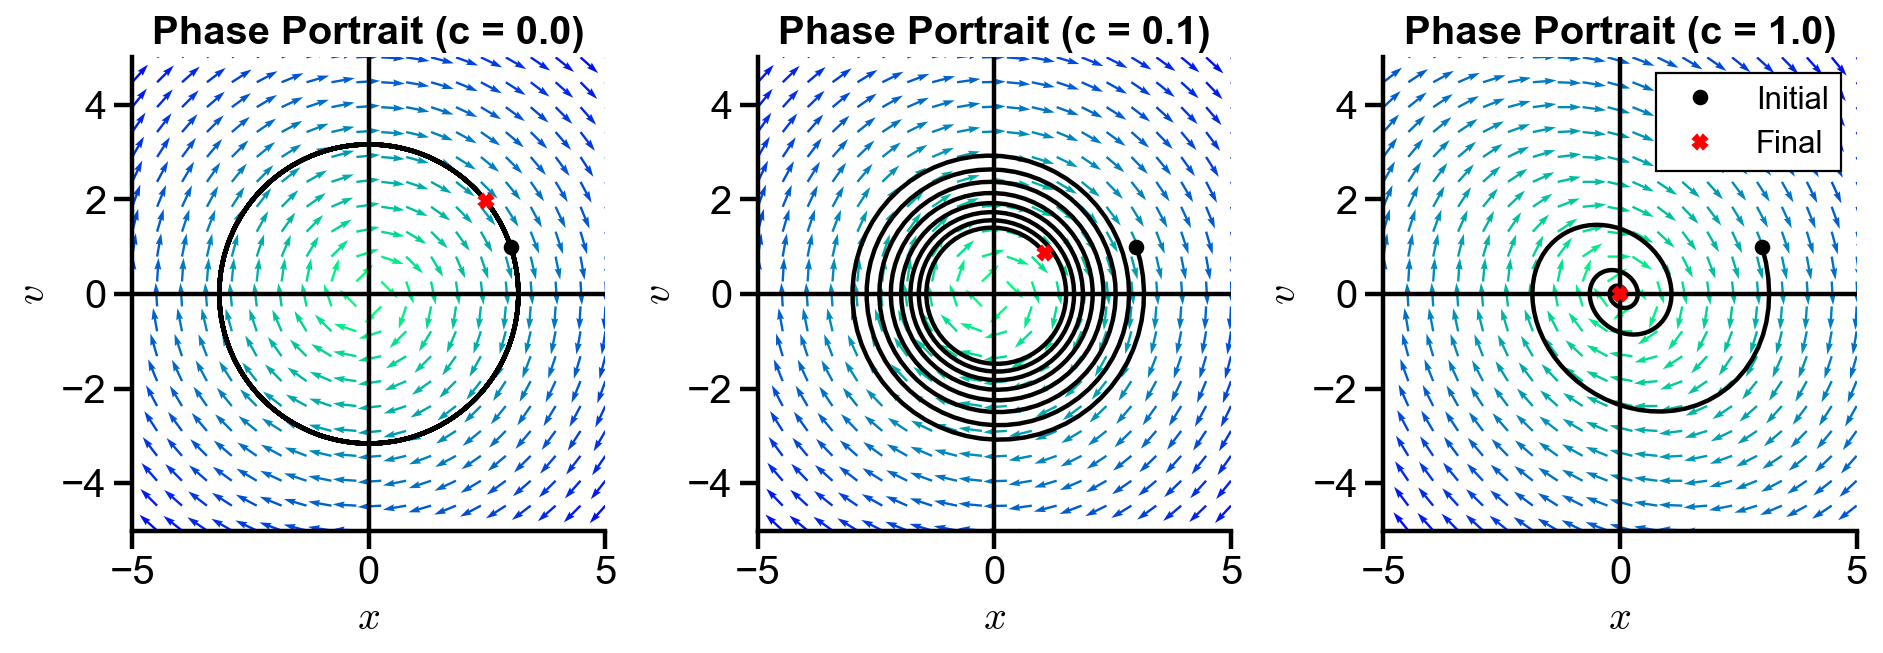
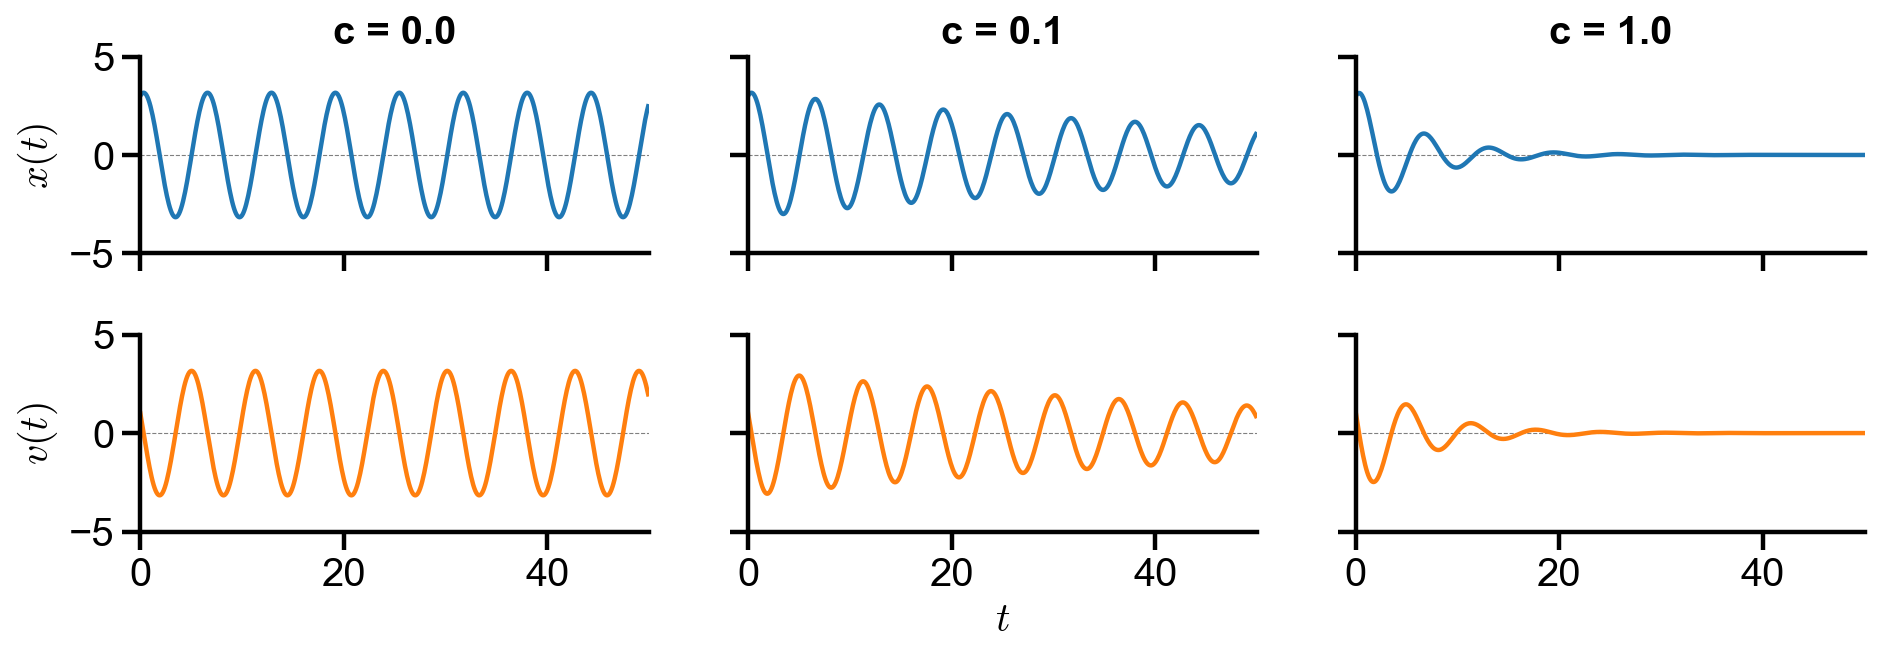
▲ The figure above shows the behavior of the system with changing damping constant
Changing spring constant
# physical params
m = 3
k = np.array([1, 3, 9])
c = 0.1
# initial conditions
x0 = 3
v0 = 1
initial_val = [x0, v0]
# time array
t_initial = 0
t_final = 50
dt = 0.1
t = np.arange(t_initial, t_final, dt)
# quiver grid
xvec = np.linspace(-5, 5, 20)
vvec = np.linspace(-5, 5, 20)
X, V = np.meshgrid(xvec, vvec)
fig1, axs1 = plt.subplots(1, 3, figsize=(12, 4))
plt.tight_layout()
fig2, axs2 = plt.subplots(2, 3, figsize=(12, 4), sharex=True, sharey=True)
plt.tight_layout()

for i in range(len(k)):
    # governing ode system
    dxdt = lambda x, v : v
    dvdt = lambda x, v : -k[i]/m*x - c/m*v
    ode_func = lambda t, z : np.array([dxdt(*z), dvdt(*z)])
    # ode soln
    ode_soln = scipy.integrate.solve_ivp(ode_func, [t_initial, t_final], initial_val, t_eval=t)
    # plot phase portrait
    scale = np.sqrt(dxdt(X, V)**2 + dvdt(X, V)**2)
    axs1[i].quiver(X, V, dxdt(X, V)/scale, dvdt(X, V)/scale, scale, cmap='winter_r', scale=20, width=0.005)
    axs1[i].plot(*initial_val, 'o', color='black', label='Initial')
    axs1[i].plot(ode_soln.y[0], ode_soln.y[1], color='black')
    axs1[i].plot(ode_soln.y[0, -1], ode_soln.y[1, -1], 'X', color='red', zorder=4, label='Final')
    # plot settings
    axs1[i].plot([-5, 5], [0, 0], color='black')
    axs1[i].plot([0, 0], [-5, 5], color='black')
    axs1[i].set_xlim(-5, 5)
    axs1[i].set_ylim(-5, 5)
    axs1[i].set_xlabel('$x$')
    axs1[i].set_ylabel('$v$')
    axs1[i].set_title(f'Phase Portrait (k = {k[i]})')
    axs1[i].set_aspect(1.0/axs1[i].get_data_ratio())  # square aspect
    # plot pver time
    axs2[0, i].plot(t, ode_soln.y[0], label='$x(t)$')
    axs2[1, i].plot(t, ode_soln.y[1], color='tab:orange', label='$v(t)$')
    axs2[1, 1].set_xlabel('$t$')
    axs2[0, 0].set_ylabel('$x(t)$')
    axs2[1, 0].set_ylabel('$v(t)$')
    axs2[0, i].set_title(f'k = {k[i]}')
    # plot settings
    for j in range(2):
        axs2[j, i].plot([0, 50], [0, 0], '--', color='grey', lw=0.5, zorder=0)
        # # plot settings
        axs2[j, i].set_xlim(0, 50)
        axs2[j, i].set_ylim(-5, 5)

axs1[0].legend(loc='upper left')
<matplotlib.legend.Legend at 0x1c08c322c08>
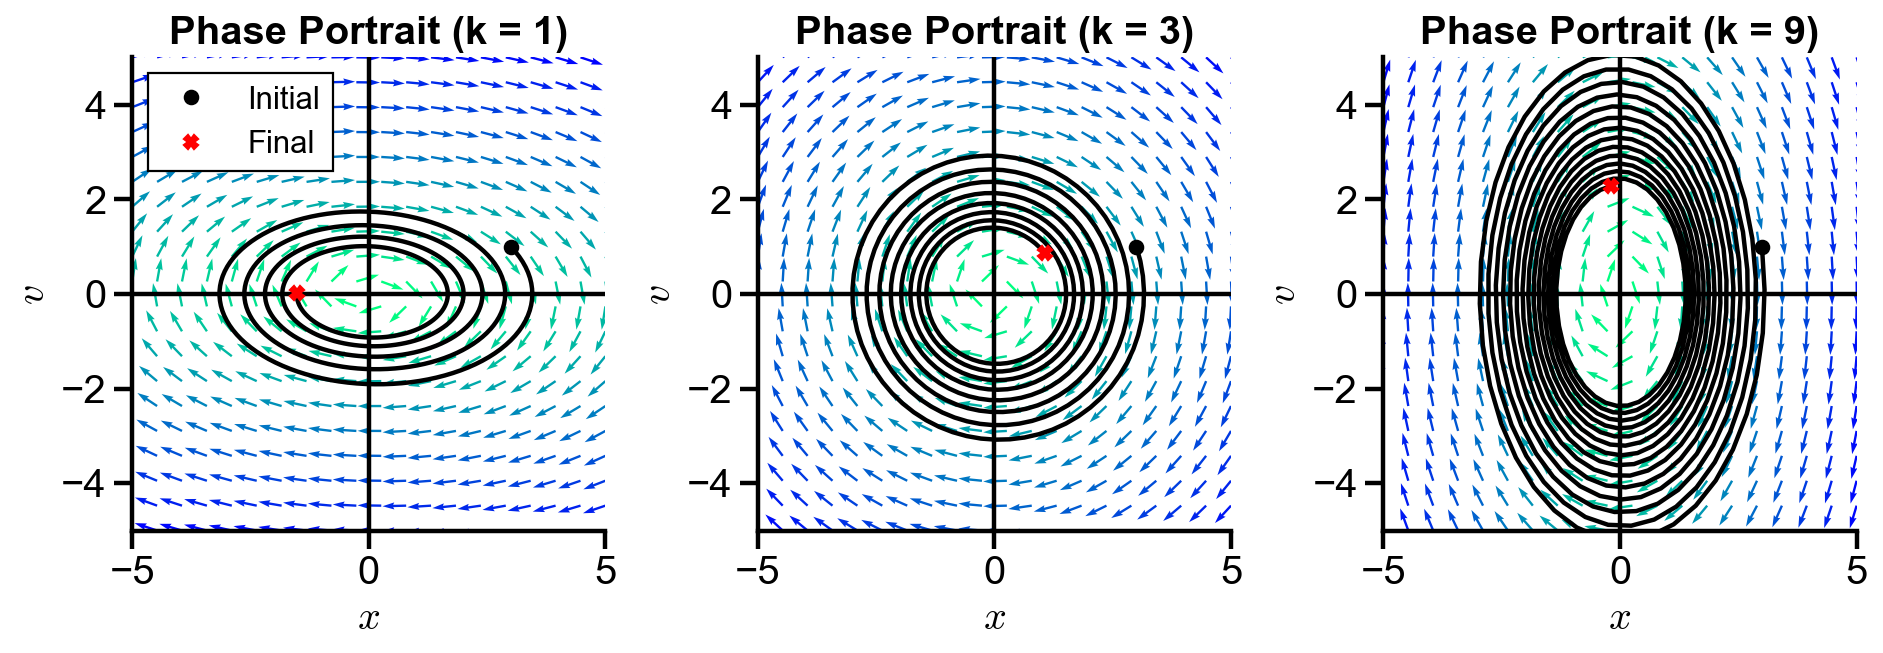
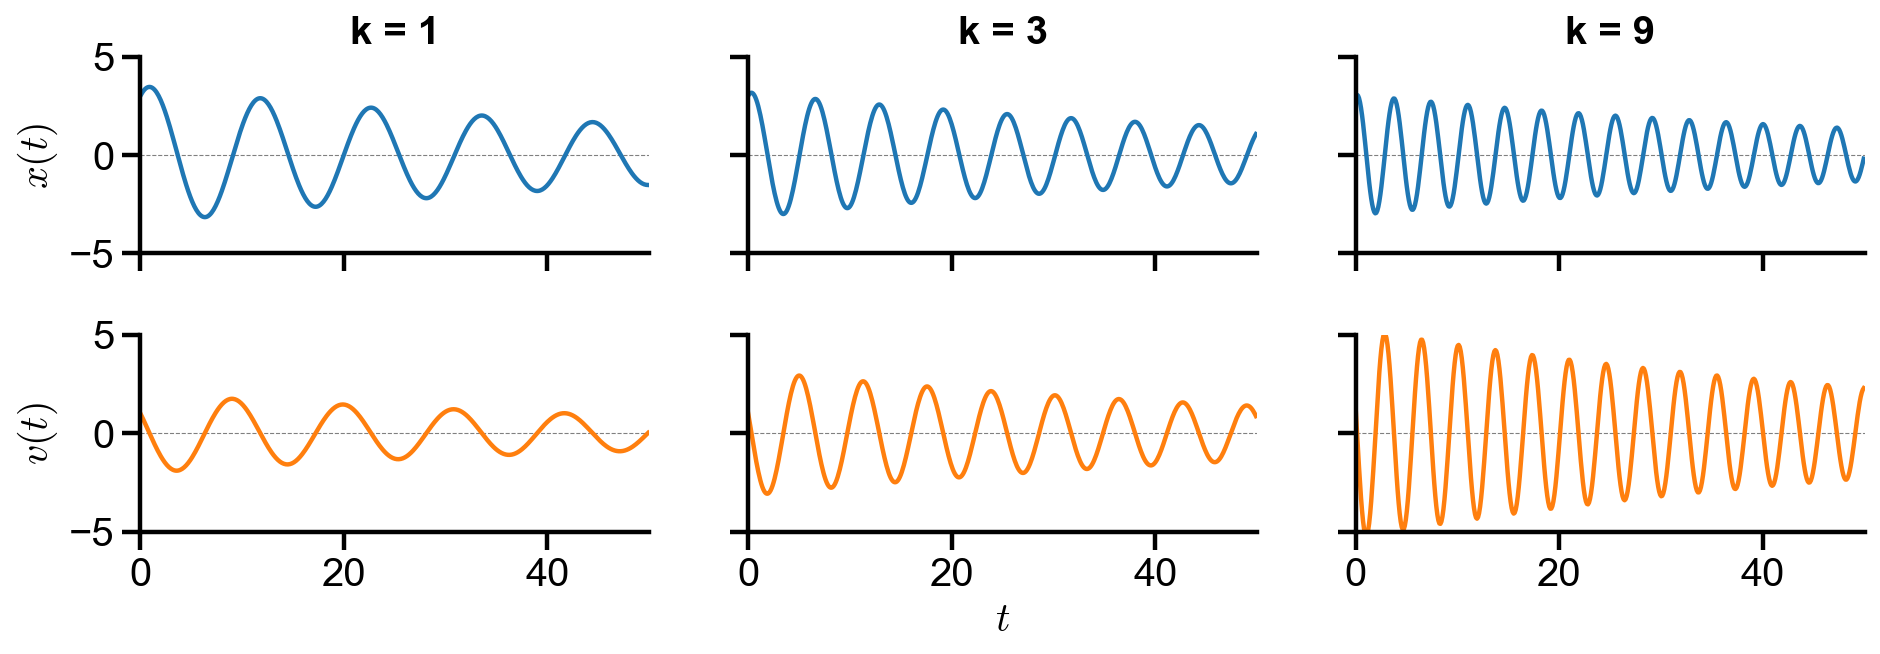
▲ The figure above shows the behavior of the system with changing spring constant
All trajectories spirals into the origin. As
Changing mass
# physical params
m = np.array([1, 3, 9])
k = 3
c = 0.1
# initial conditions
x0 = 3
v0 = 1
initial_val = [x0, v0]
# time array
t_initial = 0
t_final = 50
dt = 0.1
t = np.arange(t_initial, t_final, dt)
# quiver grid
xvec = np.linspace(-5, 5, 20)
vvec = np.linspace(-5, 5, 20)
X, V = np.meshgrid(xvec, vvec)
fig1, axs1 = plt.subplots(1, 3, figsize=(12, 4))
plt.tight_layout()
fig2, axs2 = plt.subplots(2, 3, figsize=(12, 4), sharex=True, sharey=True)
plt.tight_layout()

for i in range(len(m)):
    # governing ode system
    dxdt = lambda x, v : v
    dvdt = lambda x, v : -k/m[i]*x - c/m[i]*v
    ode_func = lambda t, z : np.array([dxdt(*z), dvdt(*z)])
    # ode soln
    ode_soln = scipy.integrate.solve_ivp(ode_func, [t_initial, t_final], initial_val, t_eval=t)
    # plot phase portrait
    scale = np.sqrt(dxdt(X, V)**2 + dvdt(X, V)**2)
    axs1[i].quiver(X, V, dxdt(X, V)/scale, dvdt(X, V)/scale, scale, cmap='winter_r', scale=20, width=0.005)
    axs1[i].plot(*initial_val, 'o', color='black', label='Initial')
    axs1[i].plot(ode_soln.y[0], ode_soln.y[1], color='black')
    axs1[i].plot(ode_soln.y[0, -1], ode_soln.y[1, -1], 'X', color='red', zorder=4, label='Final')
    # plot settings
    axs1[i].plot([-5, 5], [0, 0], color='black')
    axs1[i].plot([0, 0], [-5, 5], color='black')
    axs1[i].set_xlim(-5, 5)
    axs1[i].set_ylim(-5, 5)
    axs1[i].set_xlabel('$x$')
    axs1[i].set_ylabel('$v$')
    axs1[i].set_title(f'Phase Portrait (m = {m[i]})')
    axs1[i].set_aspect(1.0/axs1[i].get_data_ratio())  # square aspect
    # plot pver time
    axs2[0, i].plot(t, ode_soln.y[0], label='$x(t)$')
    axs2[1, i].plot(t, ode_soln.y[1], color='tab:orange', label='$v(t)$')
    axs2[1, 1].set_xlabel('$t$')
    axs2[0, 0].set_ylabel('$x(t)$')
    axs2[1, 0].set_ylabel('$v(t)$')
    axs2[0, i].set_title(f'm = {m[i]}')
    # plot settings
    for j in range(2):
        axs2[j, i].plot([0, 50], [0, 0], '--', color='grey', lw=0.5, zorder=0)
        # # plot settings
        axs2[j, i].set_xlim(0, 50)
        axs2[j, i].set_ylim(-5, 5)

axs[-1].legend(loc='upper right')
<matplotlib.legend.Legend at 0x1c08c06a1c8>
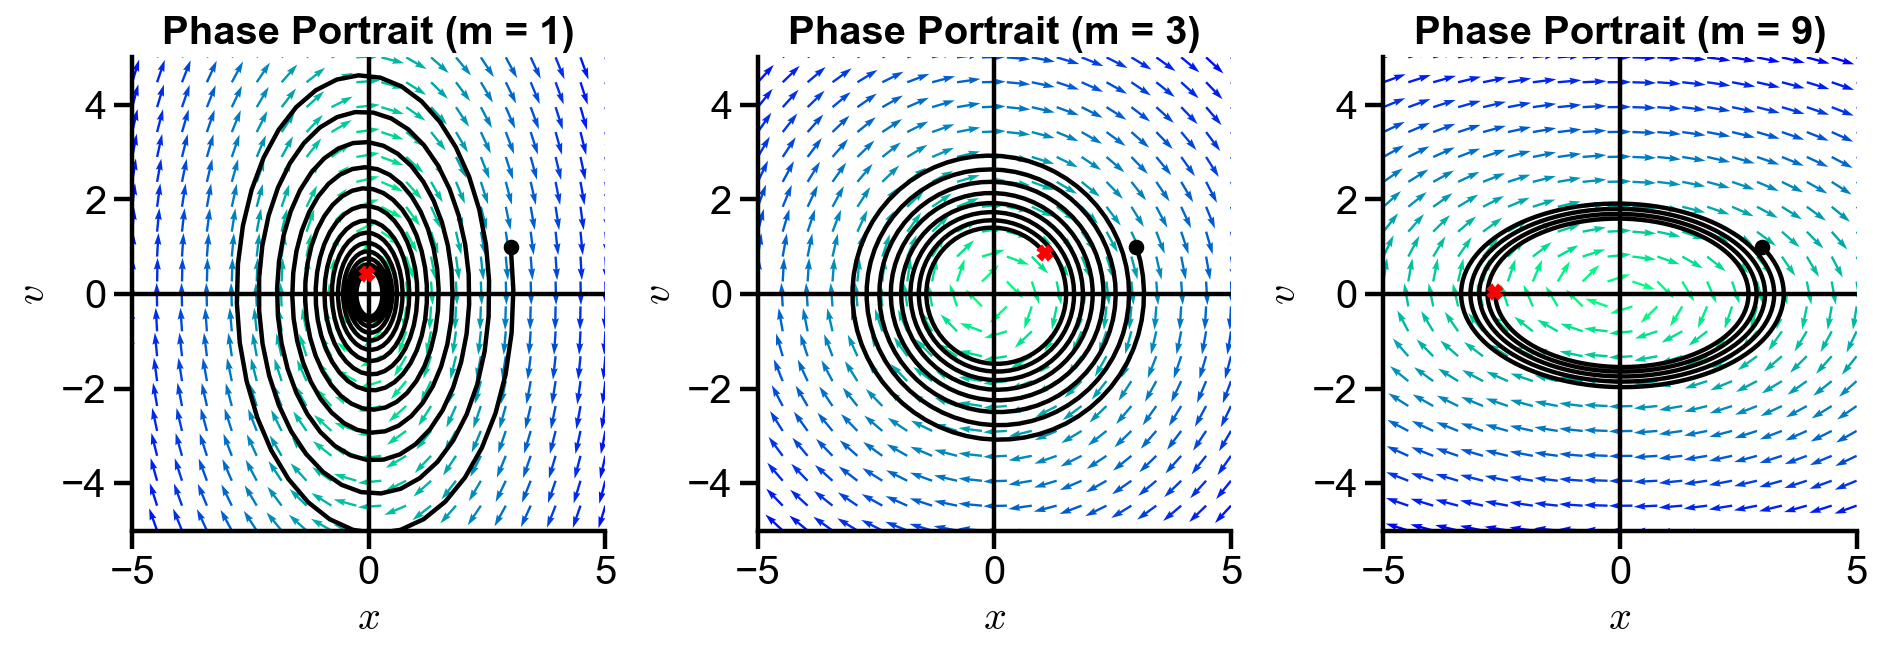
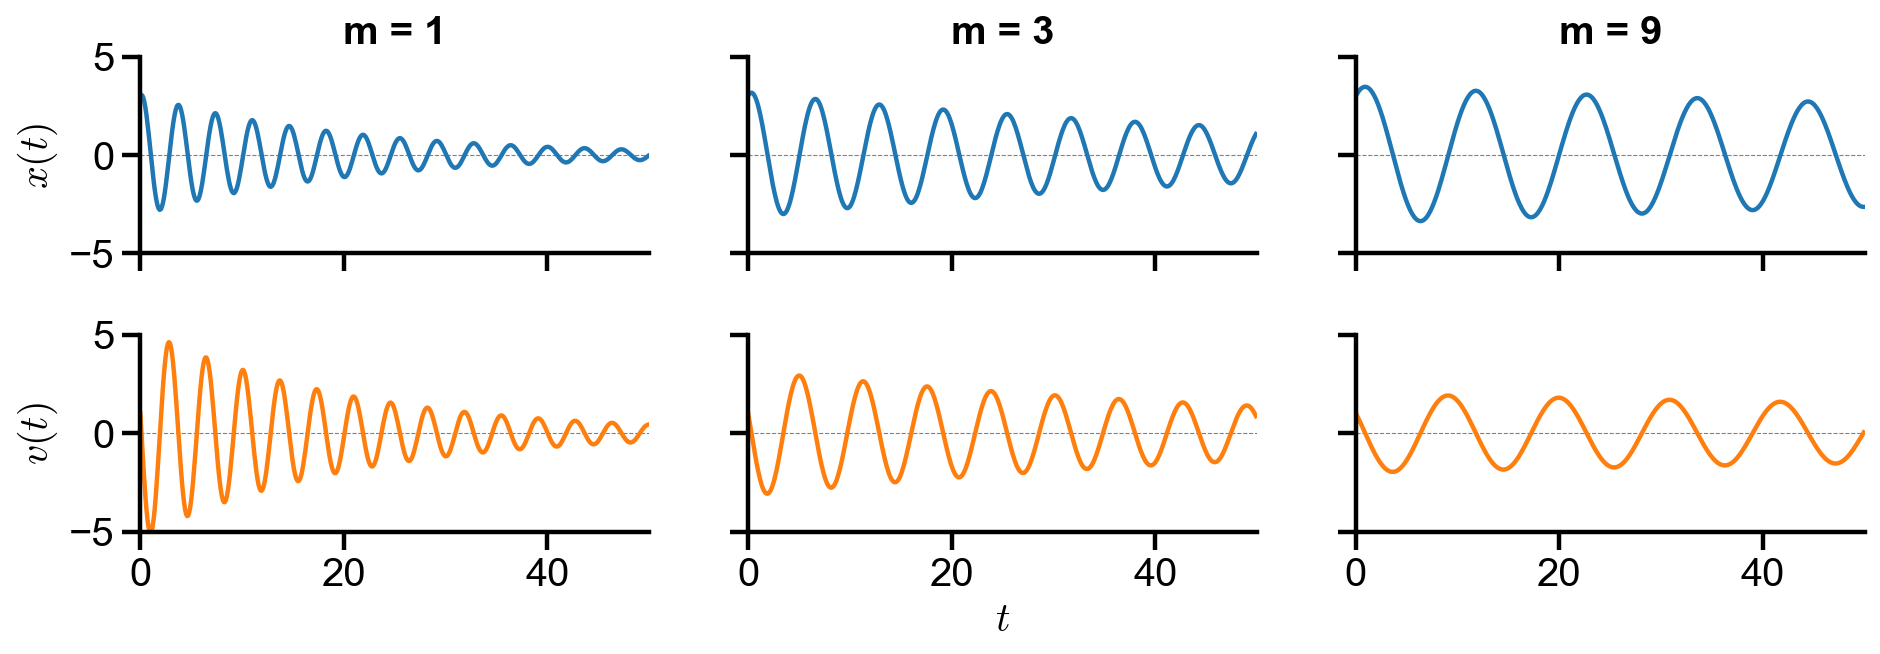
▲ The figure above shows the behavior of the system with changing mass
All trajectories spirals into the origin. Both position and velocity oscillates sinusoidally with damping over time. As

